Infrastructure Knowledge Base
CI/CD Pipeline &
Monitoring Stack
Build a real-world DevOps pipeline from scratch on two VPS servers. Every
git push automatically tests, builds, and deploys a containerised
Flask app — with Prometheus + Grafana monitoring both Linux and Windows servers,
and Alertmanager sending Slack and email alerts.
- App server — Docker + Nginx
- CI/CD deploy target
- Prometheus + Grafana hub
- Alertmanager
- Monitoring target
- windows_exporter agent
- Optional: self-hosted runner
Contents
Update the system
apt update && apt upgrade -y
Configure git
git config --global user.name "Your Name"
git config --global user.email "you@gmail.com"
git config --global init.defaultBranch main
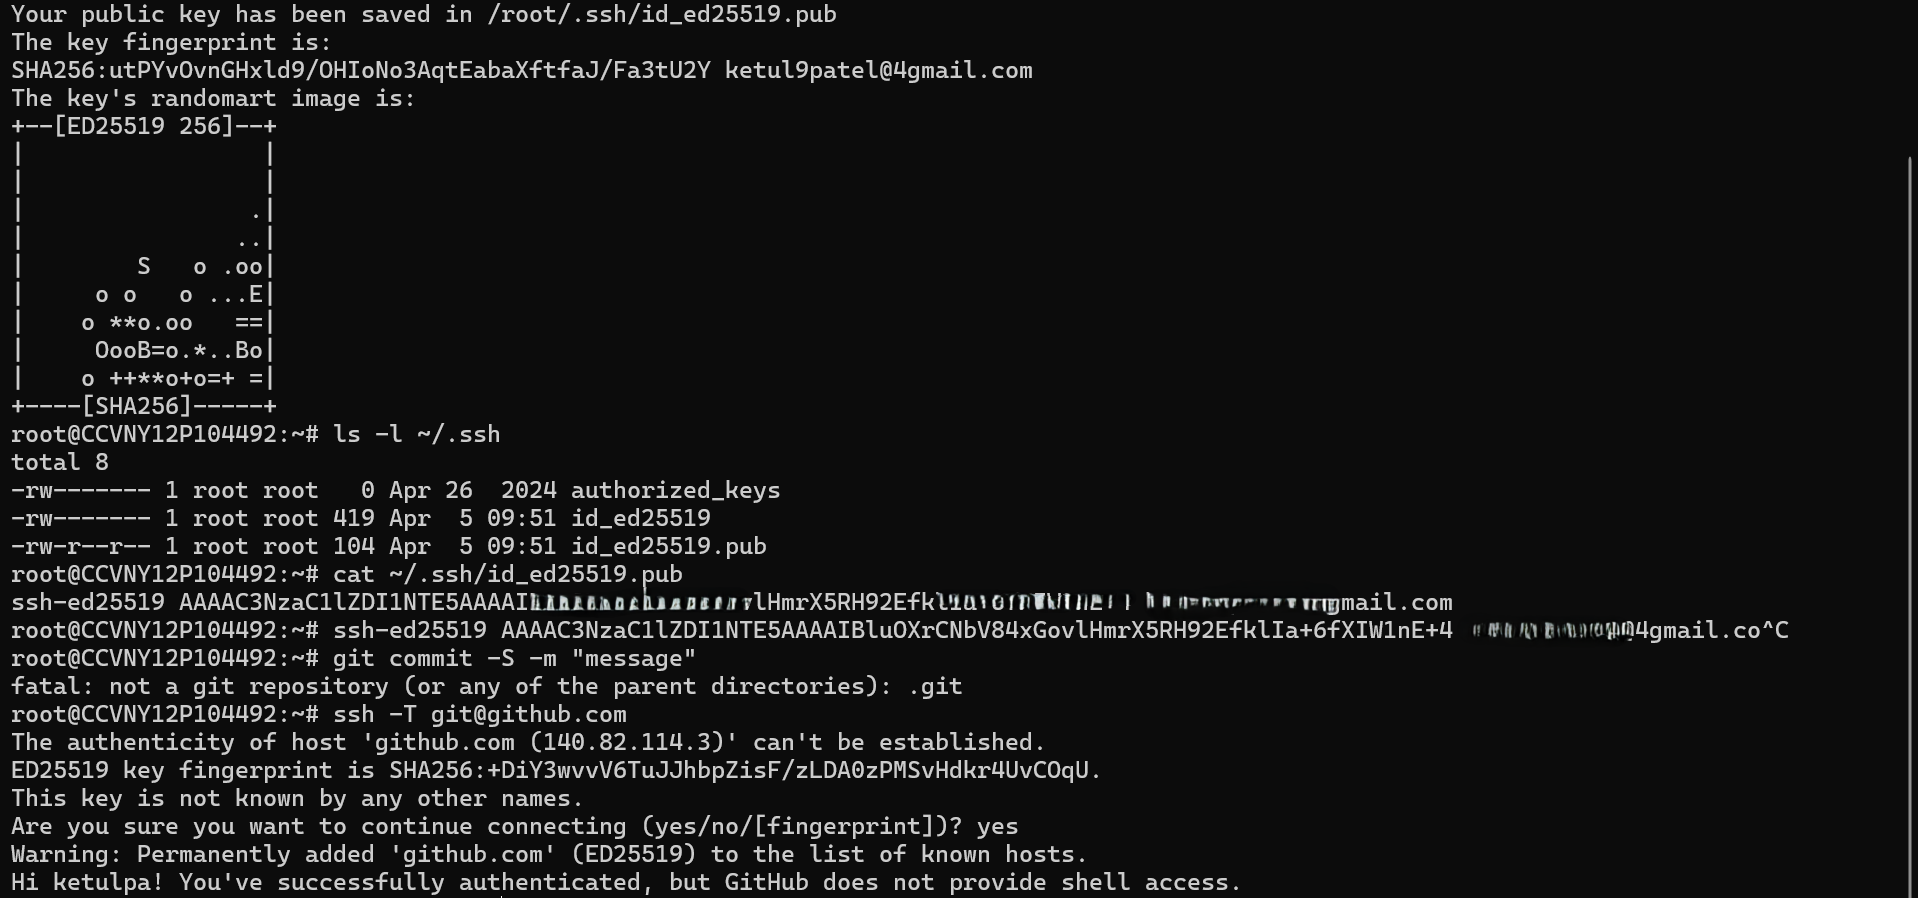
Set up SSH key for GitHub
# Generate the key
ssh-keygen -t ed25519 -C "you@gmail.com"

# Print the public key — copy this to GitHub
cat ~/.ssh/id_ed25519.pub

# Test after adding key at github.com → Settings → SSH keys
ssh -T git@github.com
Install Docker
apt install -y ca-certificates curl
install -m 0755 -d /etc/apt/keyrings
curl -fsSL https://download.docker.com/linux/ubuntu/gpg \
  -o /etc/apt/keyrings/docker.asc
chmod a+r /etc/apt/keyrings/docker.asc

echo "deb [arch=$(dpkg --print-architecture) \
  signed-by=/etc/apt/keyrings/docker.asc] \
  https://download.docker.com/linux/ubuntu \
  $(. /etc/os-release && echo "$VERSION_CODENAME") stable" \
  | tee /etc/apt/sources.list.d/docker.list > /dev/null

apt update
apt install -y docker-ce docker-ce-cli containerd.io docker-compose-plugin

docker --version
docker run hello-world
Create the repo and clone it
Create a new repo at github.com → New repository, name it devops-pipeline, then:
git clone git@github.com:YOURUSERNAME/devops-pipeline.git
cd devops-pipeline
mkdir -p app .github/workflows
Create the Flask application
from flask import Flask, jsonify
from prometheus_flask_exporter import PrometheusMetrics

app = Flask(__name__)
metrics = PrometheusMetrics(app)

@app.route('/')
def home():
    return jsonify({
        "status": "running",
        "message": "DevOps Pipeline",
        "version": "1.0"
    })

@app.route('/health')
def health():
    return jsonify({"status": "healthy"}), 200

if __name__ == '__main__':
    app.run(host='0.0.0.0', port=5000)
Create requirements.txt and Dockerfile
flask==3.0.3
prometheus-flask-exporter==0.23.1
FROM python:3.12-slim
WORKDIR /app
COPY requirements.txt .
RUN pip install --no-cache-dir -r requirements.txt
COPY app.py .
EXPOSE 5000
CMD ["python", "app.py"]
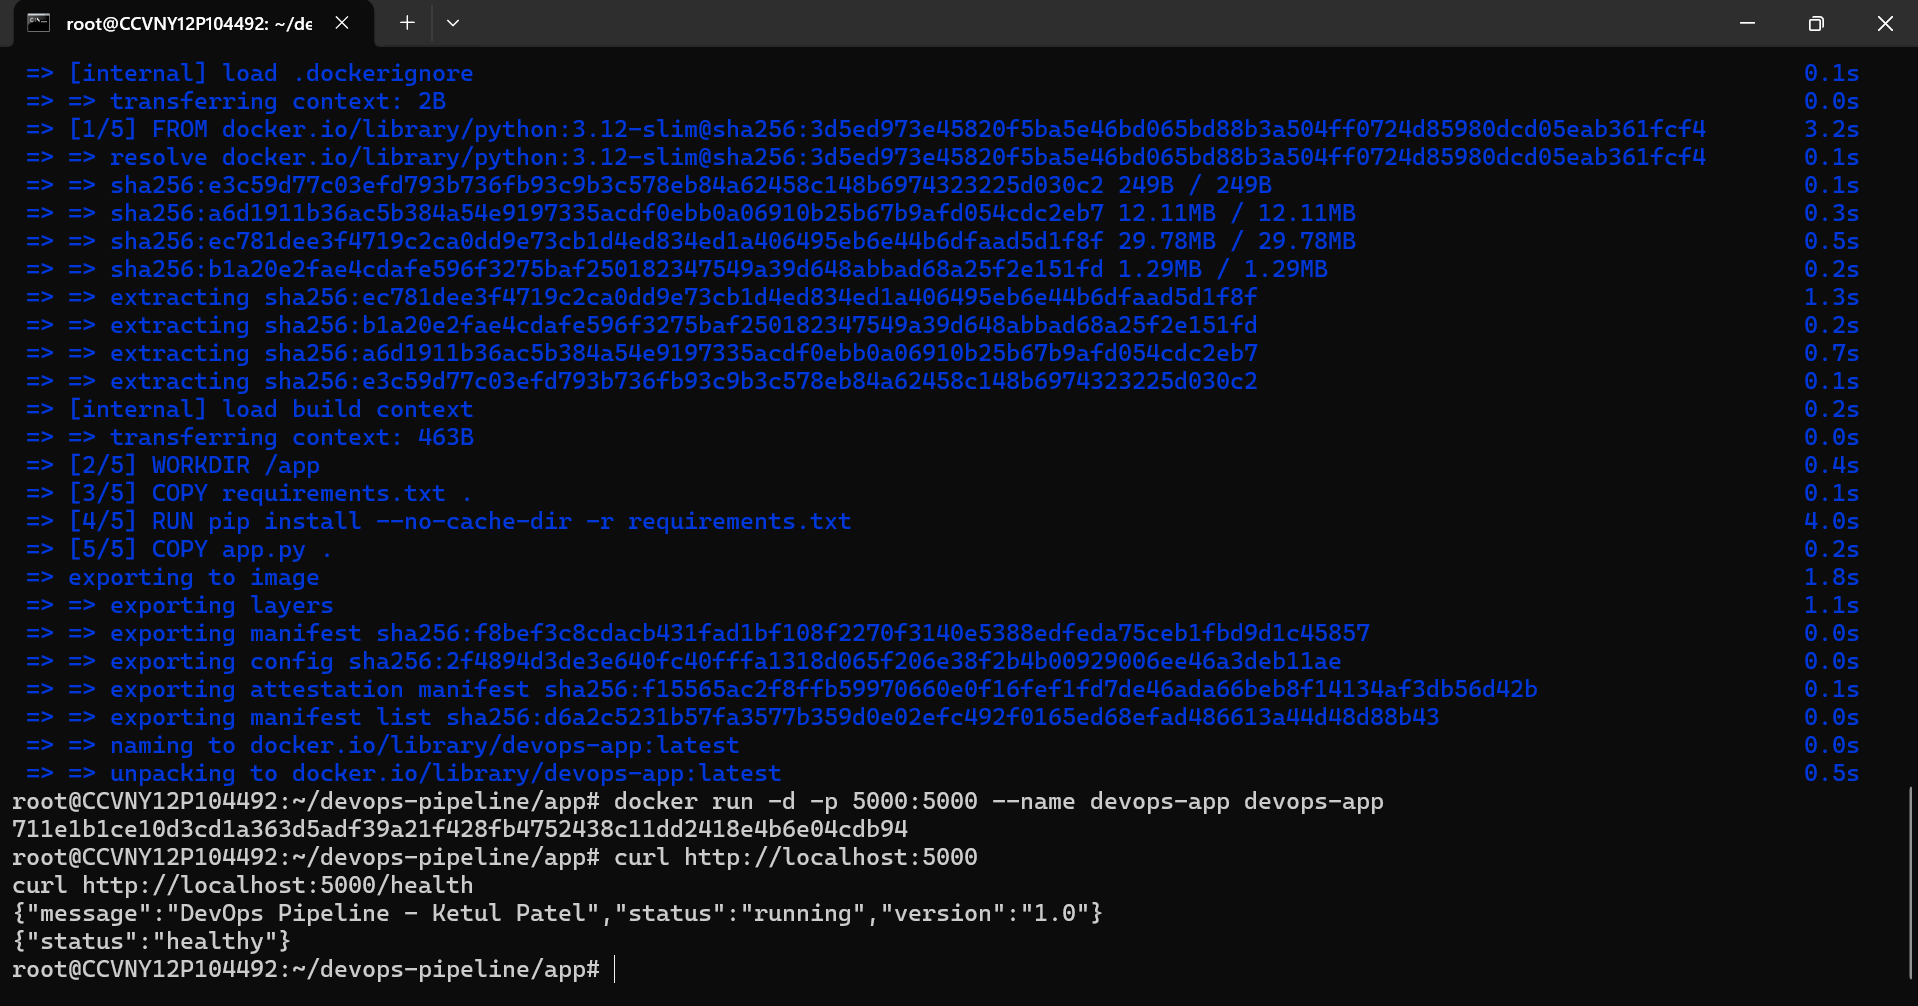
Build and run the container
cd ~/devops-pipeline/app
docker build -t devops-app .
docker run -d -p 5000:5000 --name devops-app devops-app

curl http://localhost:5000
curl http://localhost:5000/health
curl http://localhost:5000/metrics
Create SSH deploy key for GitHub Actions
# Generate dedicated deploy key (no passphrase)
ssh-keygen -t ed25519 -f ~/.ssh/github_actions \
  -C "github-actions-deploy" -N ""

# Add public key to authorised_keys
cat ~/.ssh/github_actions.pub >> ~/.ssh/authorized_keys

# Print private key — copy everything for GitHub Secrets
cat ~/.ssh/github_actions
VPS_HOST — your Linux VPS IPVPS_USER — your SSH usernameVPS_SSH_KEY — entire private key including BEGIN/END lines
Create the workflow file
name: CI/CD Pipeline

on:
  push:
    branches: [main]

jobs:
  deploy:
    runs-on: ubuntu-latest
    steps:
      - name: Checkout code
        uses: actions/checkout@v4

      - name: Build Docker image
        run: docker build -t devops-app ./app

      - name: Deploy to VPS
        uses: appleboy/ssh-action@v1
        with:
          host: $
          username: $
          key: $
          script: |
            cd ~/devops-pipeline
            git pull origin main
            docker stop devops-app || true
            docker rm devops-app || true
            docker build -t devops-app ./app
            docker run -d -p 5000:5000 --name devops-app devops-app
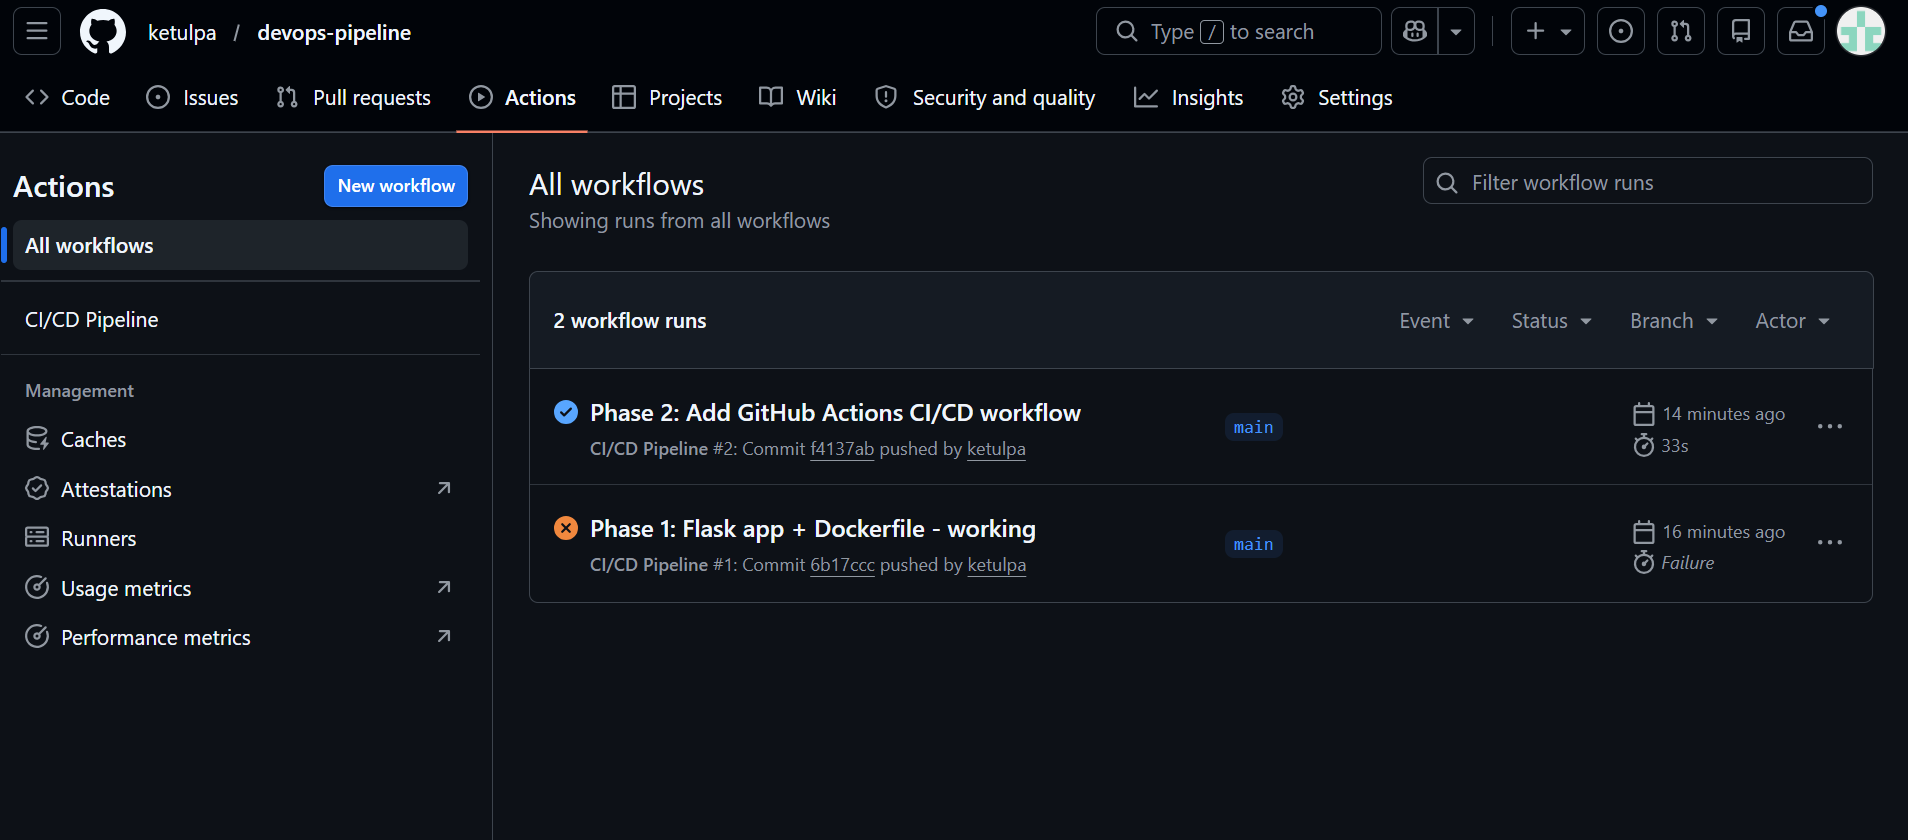
Push and verify — watch Actions tab
git add .
git commit -m "Phase 2: Add GitHub Actions CI/CD workflow"
git push origin main
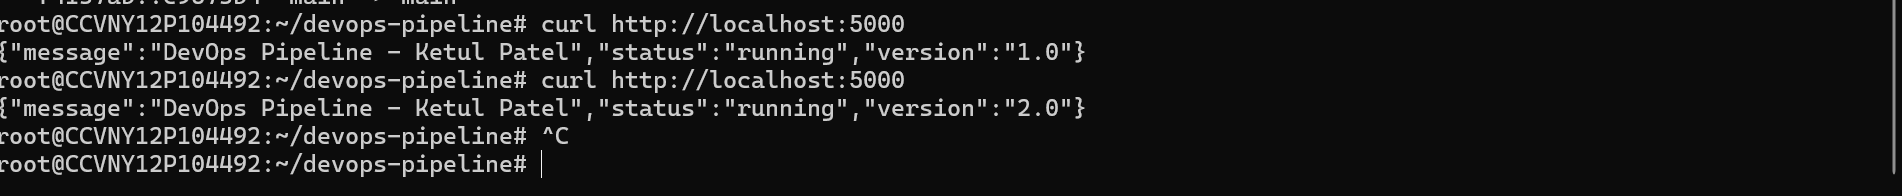
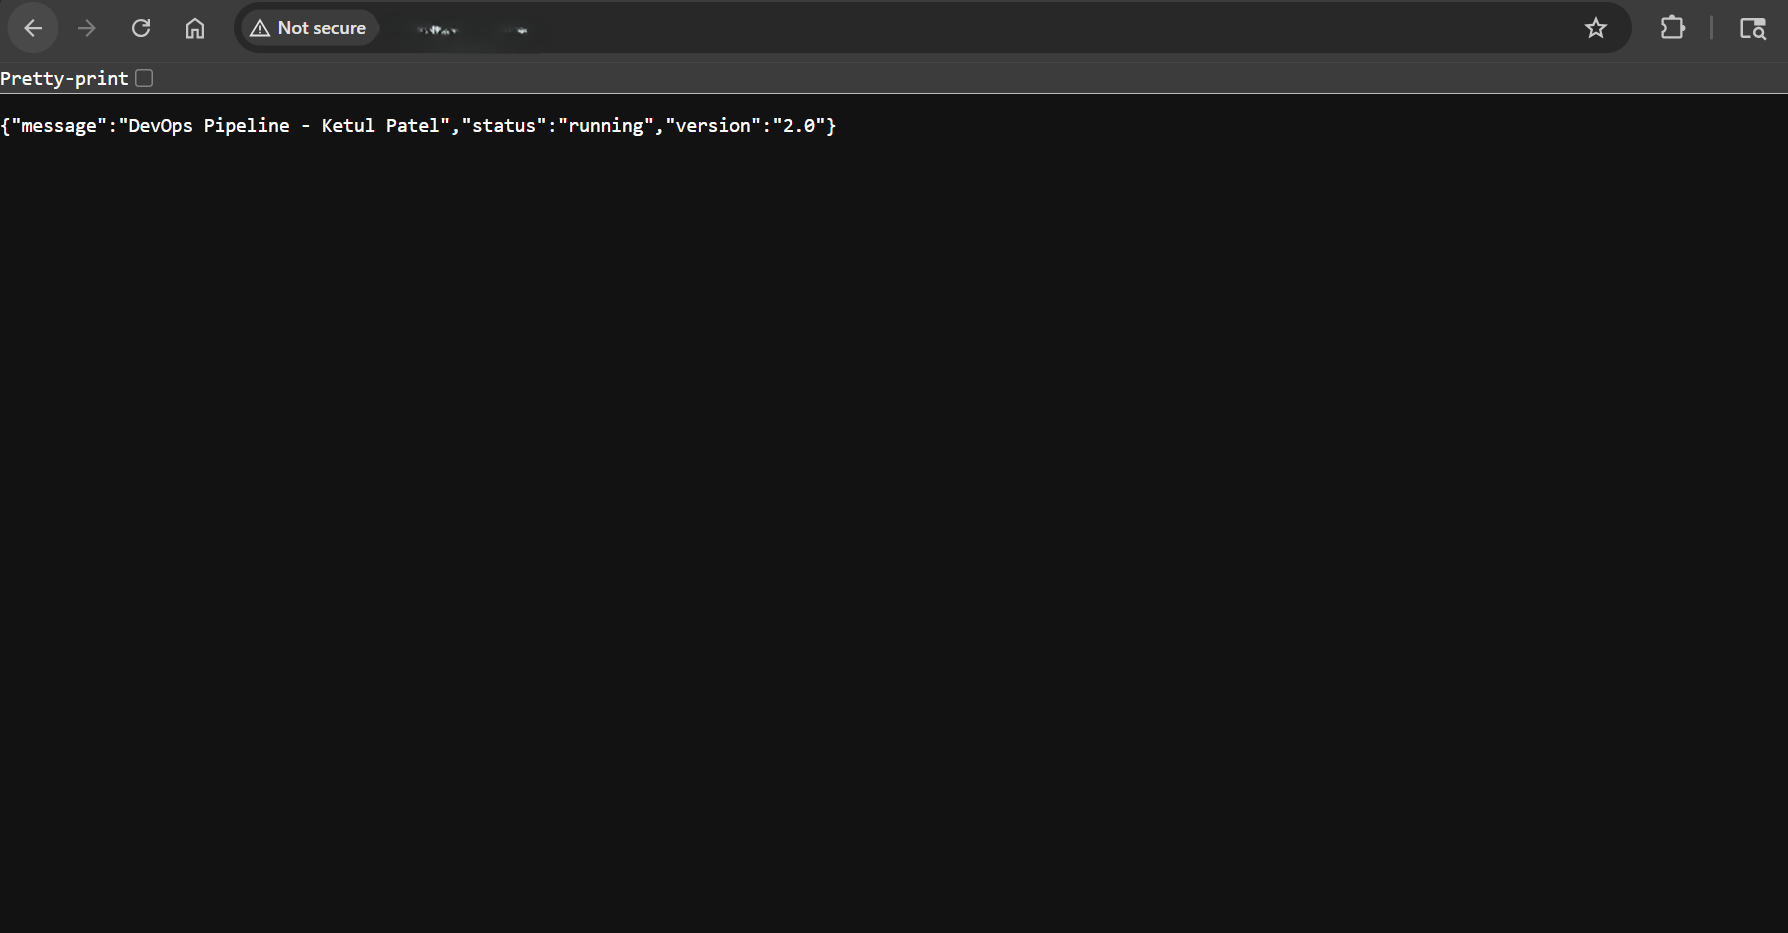
Prove auto-deploy works — change version to 2.0
Edit app.py, change version from "1.0" to "2.0", commit and push. No manual Docker commands needed — the pipeline does everything.
Install Nginx
apt install -y nginx
systemctl enable nginx && systemctl start nginx
Create the site config
server {
    listen 80;
    server_name _;

    location / {
        proxy_pass         http://127.0.0.1:5000;
        proxy_set_header   Host $host;
        proxy_set_header   X-Real-IP $remote_addr;
        proxy_set_header   X-Forwarded-For $proxy_add_x_forwarded_for;
    }
}
Enable and reload
ln -s /etc/nginx/sites-available/devops-app /etc/nginx/sites-enabled/
rm /etc/nginx/sites-enabled/default
nginx -t && systemctl reload nginx
curl http://localhost:80
Install node_exporter (Linux metrics)
wget https://github.com/prometheus/node_exporter/releases/download/v1.8.0/node_exporter-1.8.0.linux-amd64.tar.gz
tar -xvf node_exporter-1.8.0.linux-amd64.tar.gz
mv node_exporter-1.8.0.linux-amd64/node_exporter /usr/local/bin/
rm -rf node_exporter-1.8.0.linux-amd64*

cat > /etc/systemd/system/node_exporter.service << 'EOF'
[Unit]
Description=Node Exporter
After=network.target
[Service]
User=root
ExecStart=/usr/local/bin/node_exporter
[Install]
WantedBy=multi-user.target
EOF

systemctl daemon-reload
systemctl enable --now node_exporter
Install and configure Prometheus
wget https://github.com/prometheus/prometheus/releases/download/v2.51.0/prometheus-2.51.0.linux-amd64.tar.gz
tar -xvf prometheus-2.51.0.linux-amd64.tar.gz
mv prometheus-2.51.0.linux-amd64/prometheus /usr/local/bin/
mkdir -p /etc/prometheus /var/lib/prometheus
rm -rf prometheus-2.51.0.linux-amd64*
global:
  scrape_interval: 15s

scrape_configs:
  - job_name: 'linux-vps'
    static_configs:
      - targets: ['localhost:9100']

  - job_name: 'flask-app'
    static_configs:
      - targets: ['localhost:5000']

  - job_name: 'windows-vps'
    static_configs:
      - targets: ['WINDOWS_VPS_IP:9182']
Install windows_exporter on Windows VPS
Download the .msi from the windows_exporter releases page and run it with all defaults. Then open the firewall:
New-NetFirewallRule -DisplayName "windows_exporter" `
  -Direction Inbound -Protocol TCP `
  -LocalPort 9182 -Action Allow
Install Grafana and import dashboards
apt install -y software-properties-common
wget -q -O - https://packages.grafana.com/gpg.key | apt-key add -
echo "deb https://packages.grafana.com/oss/deb stable main" \
  > /etc/apt/sources.list.d/grafana.list
apt update && apt install -y grafana
systemctl enable --now grafana-server
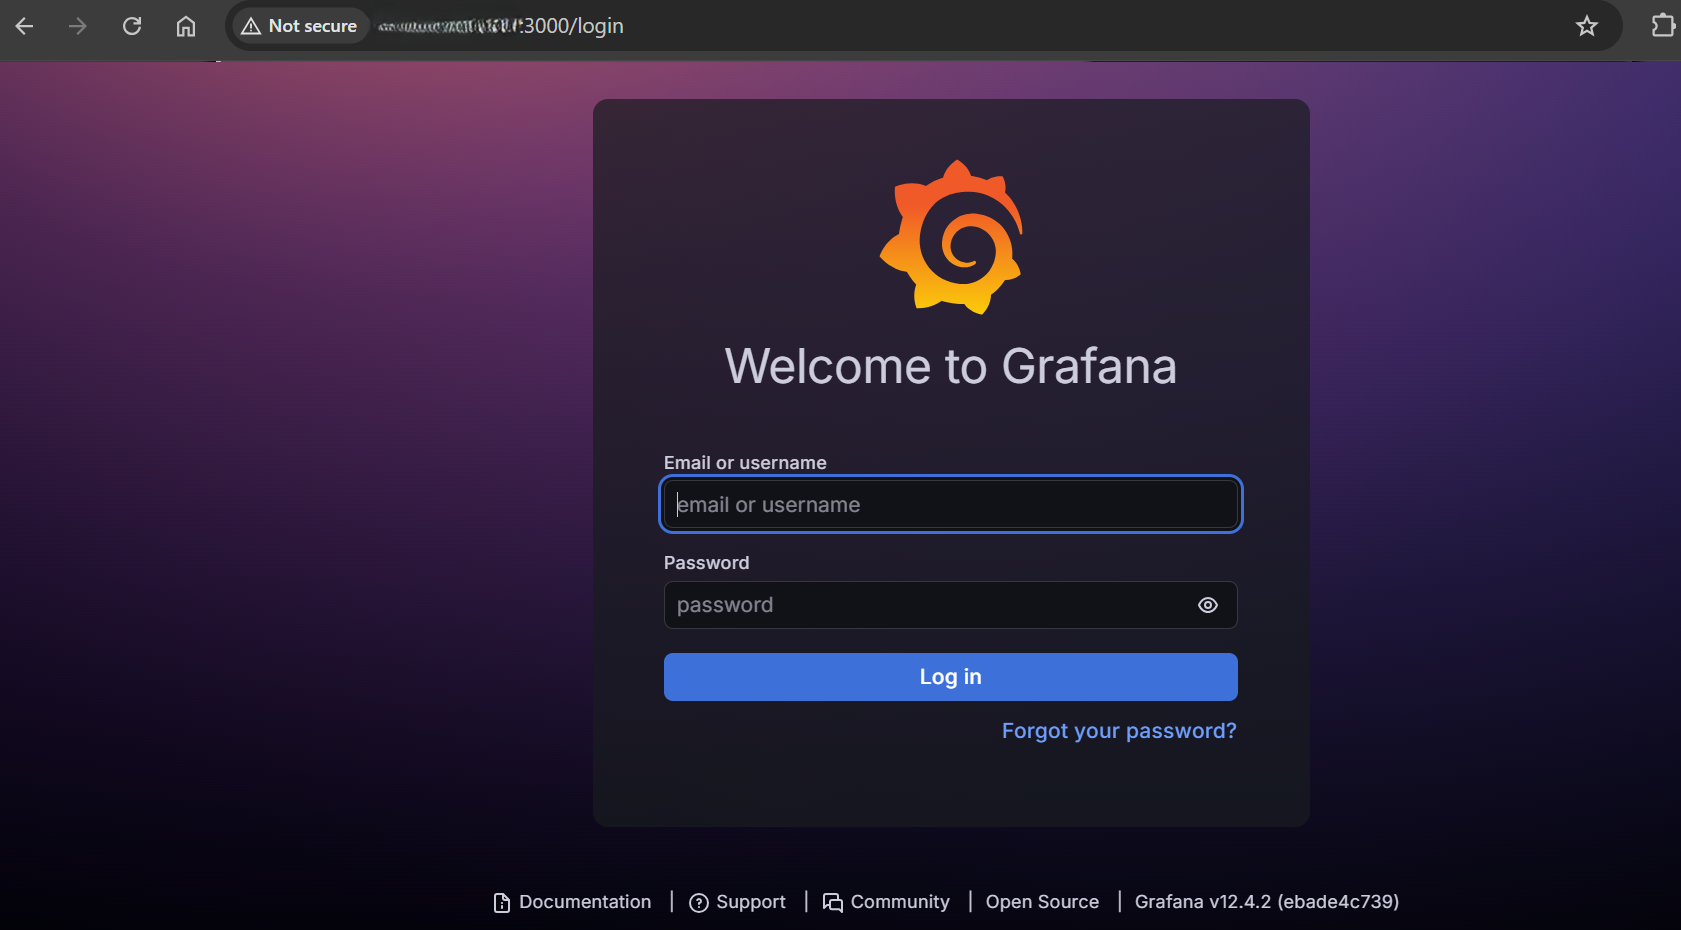
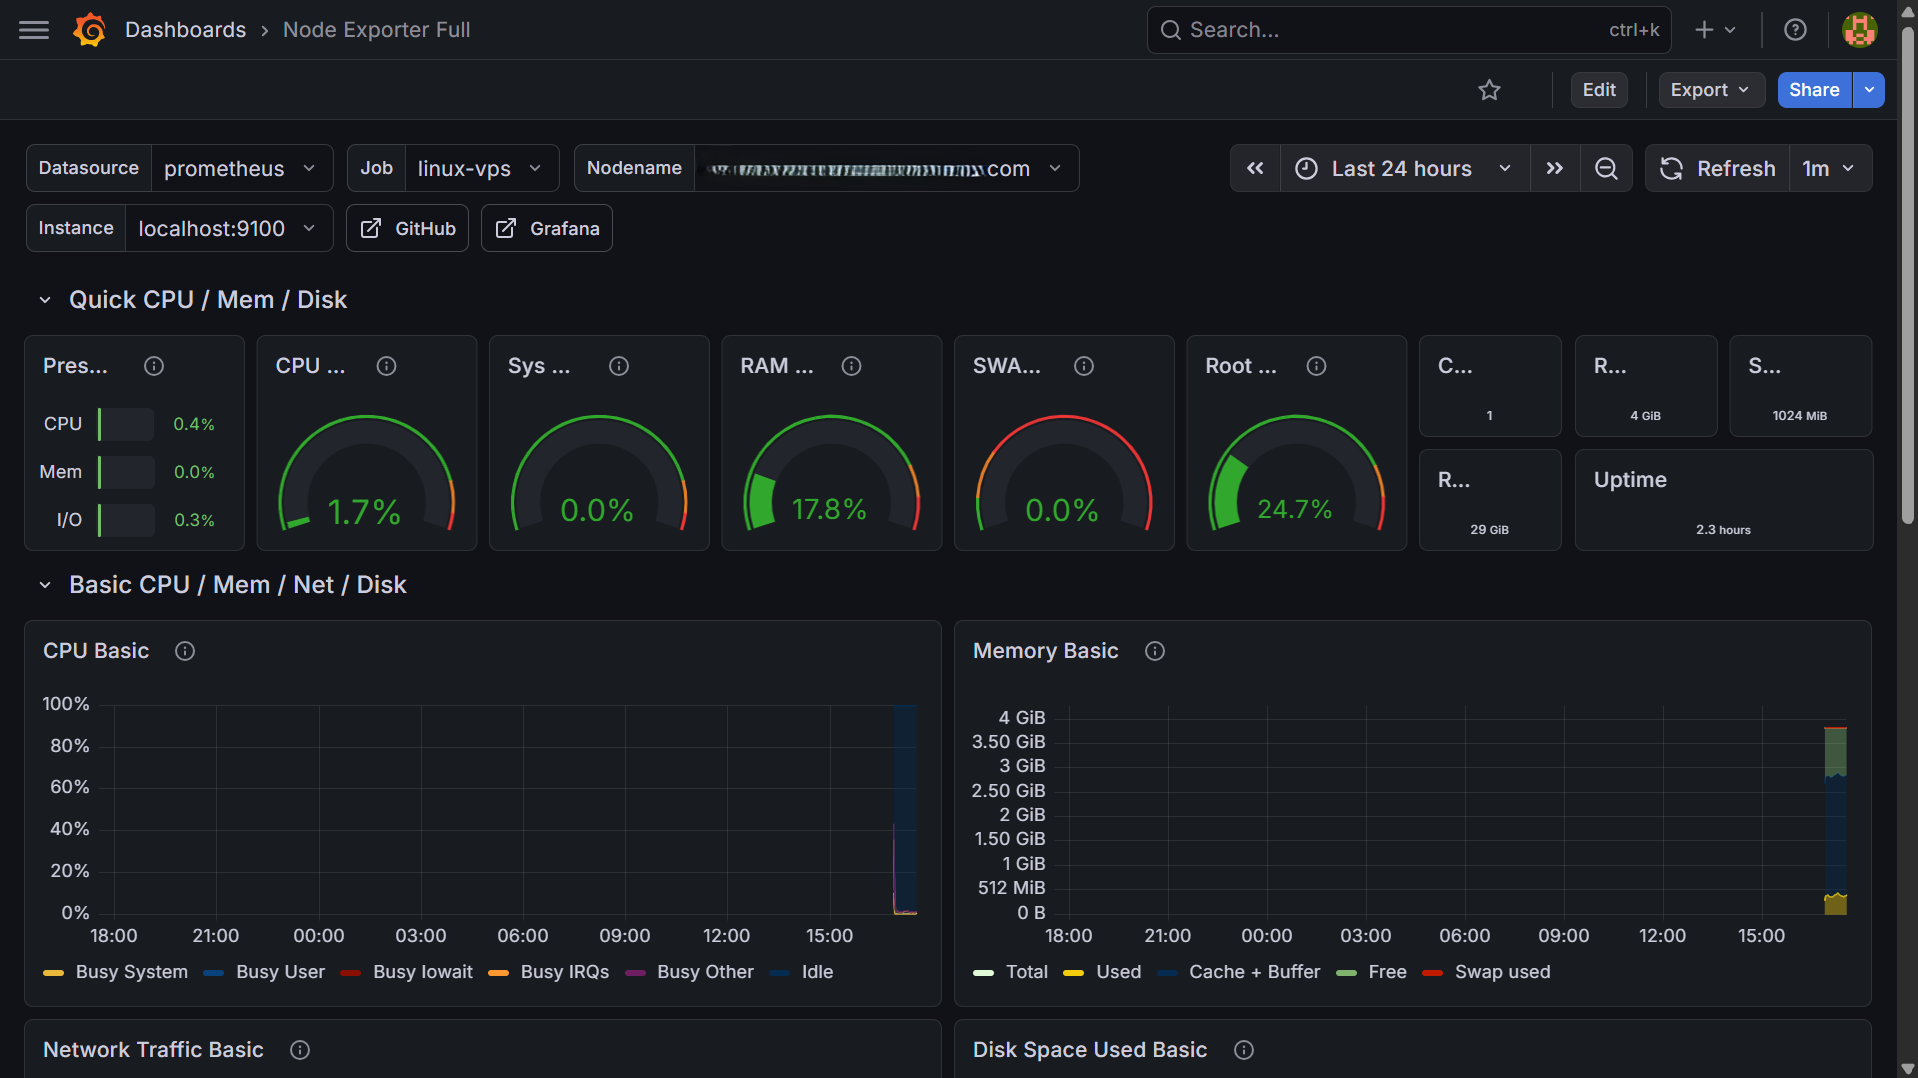
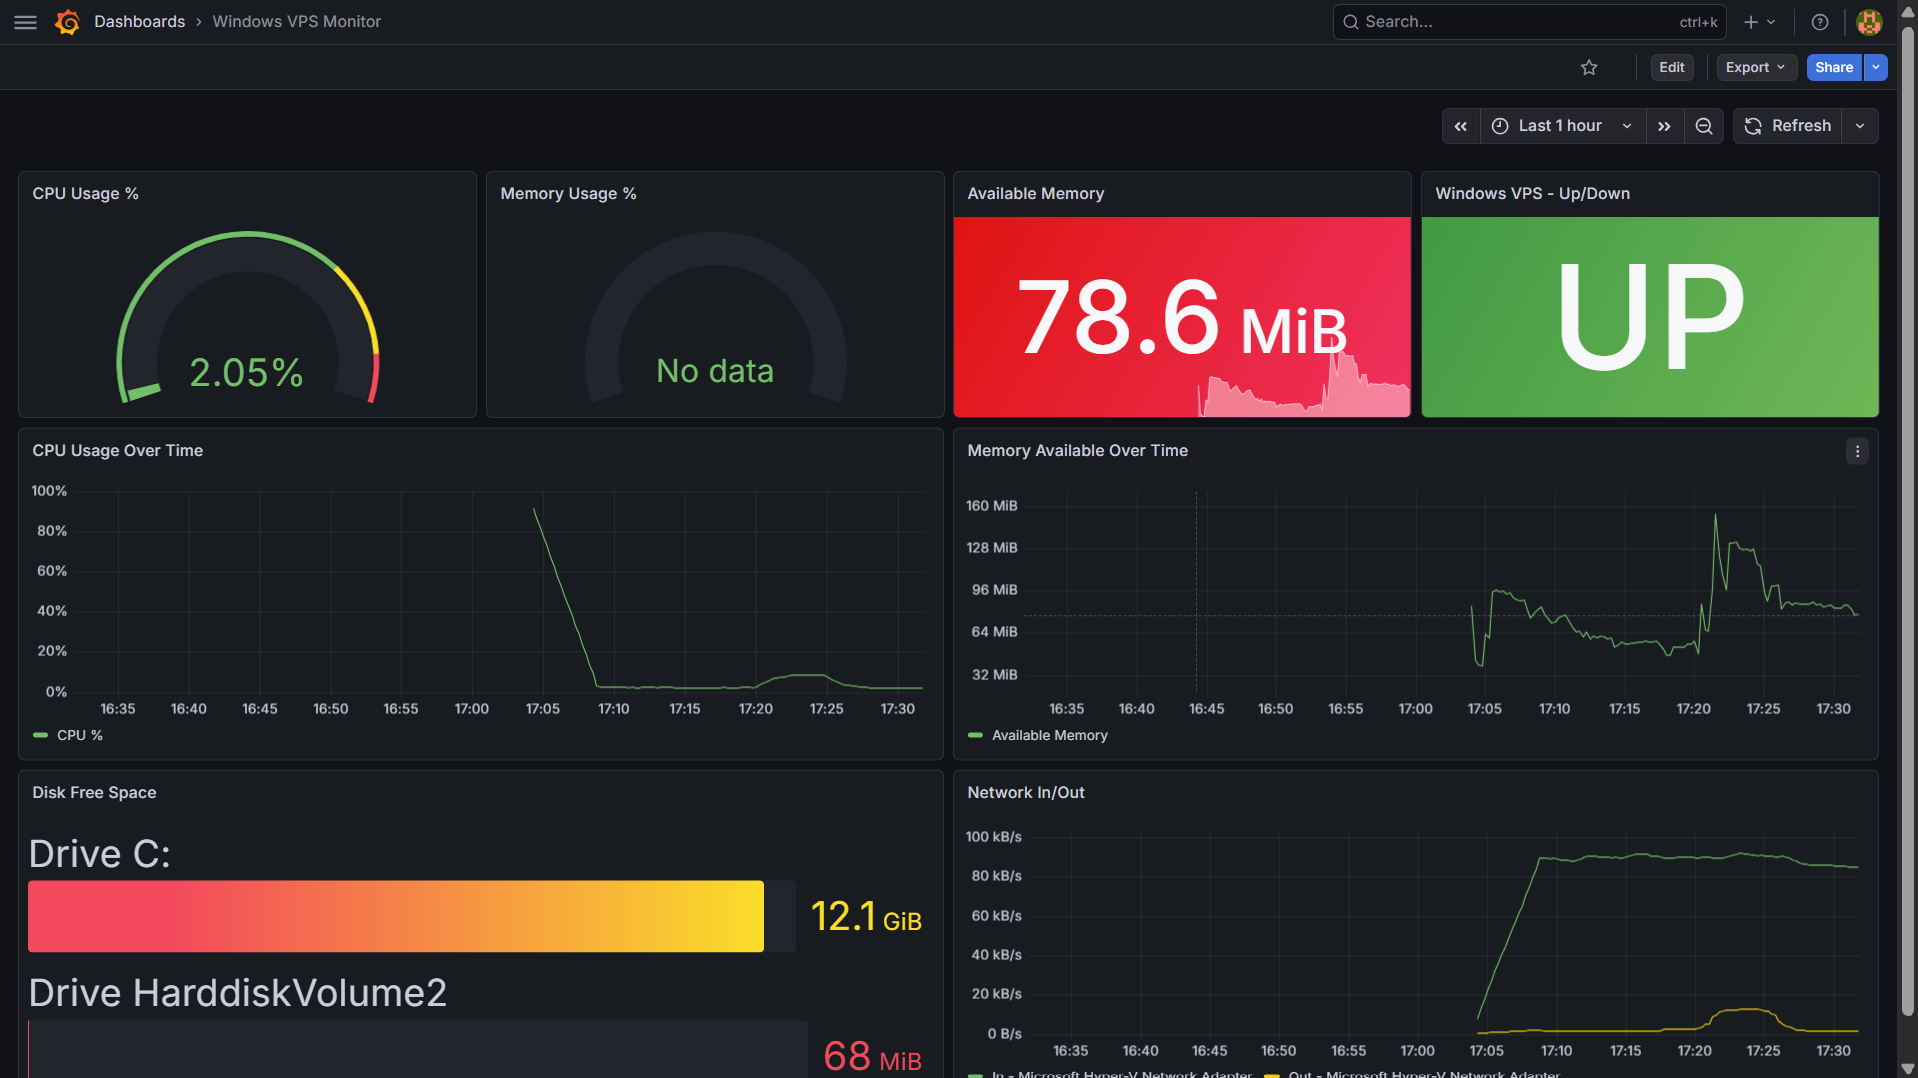
Access at http://YOUR_VPS_IP:3000 — login admin/admin. Add Prometheus data source, then import dashboard IDs 1860 (Linux) and 20763 (Windows).
Install Alertmanager
wget https://github.com/prometheus/alertmanager/releases/download/v0.27.0/alertmanager-0.27.0.linux-amd64.tar.gz
tar -xvf alertmanager-0.27.0.linux-amd64.tar.gz
mv alertmanager-0.27.0.linux-amd64/alertmanager /usr/local/bin/
mv alertmanager-0.27.0.linux-amd64/amtool /usr/local/bin/
mkdir -p /etc/alertmanager /var/lib/alertmanager
rm -rf alertmanager-0.27.0.linux-amd64*
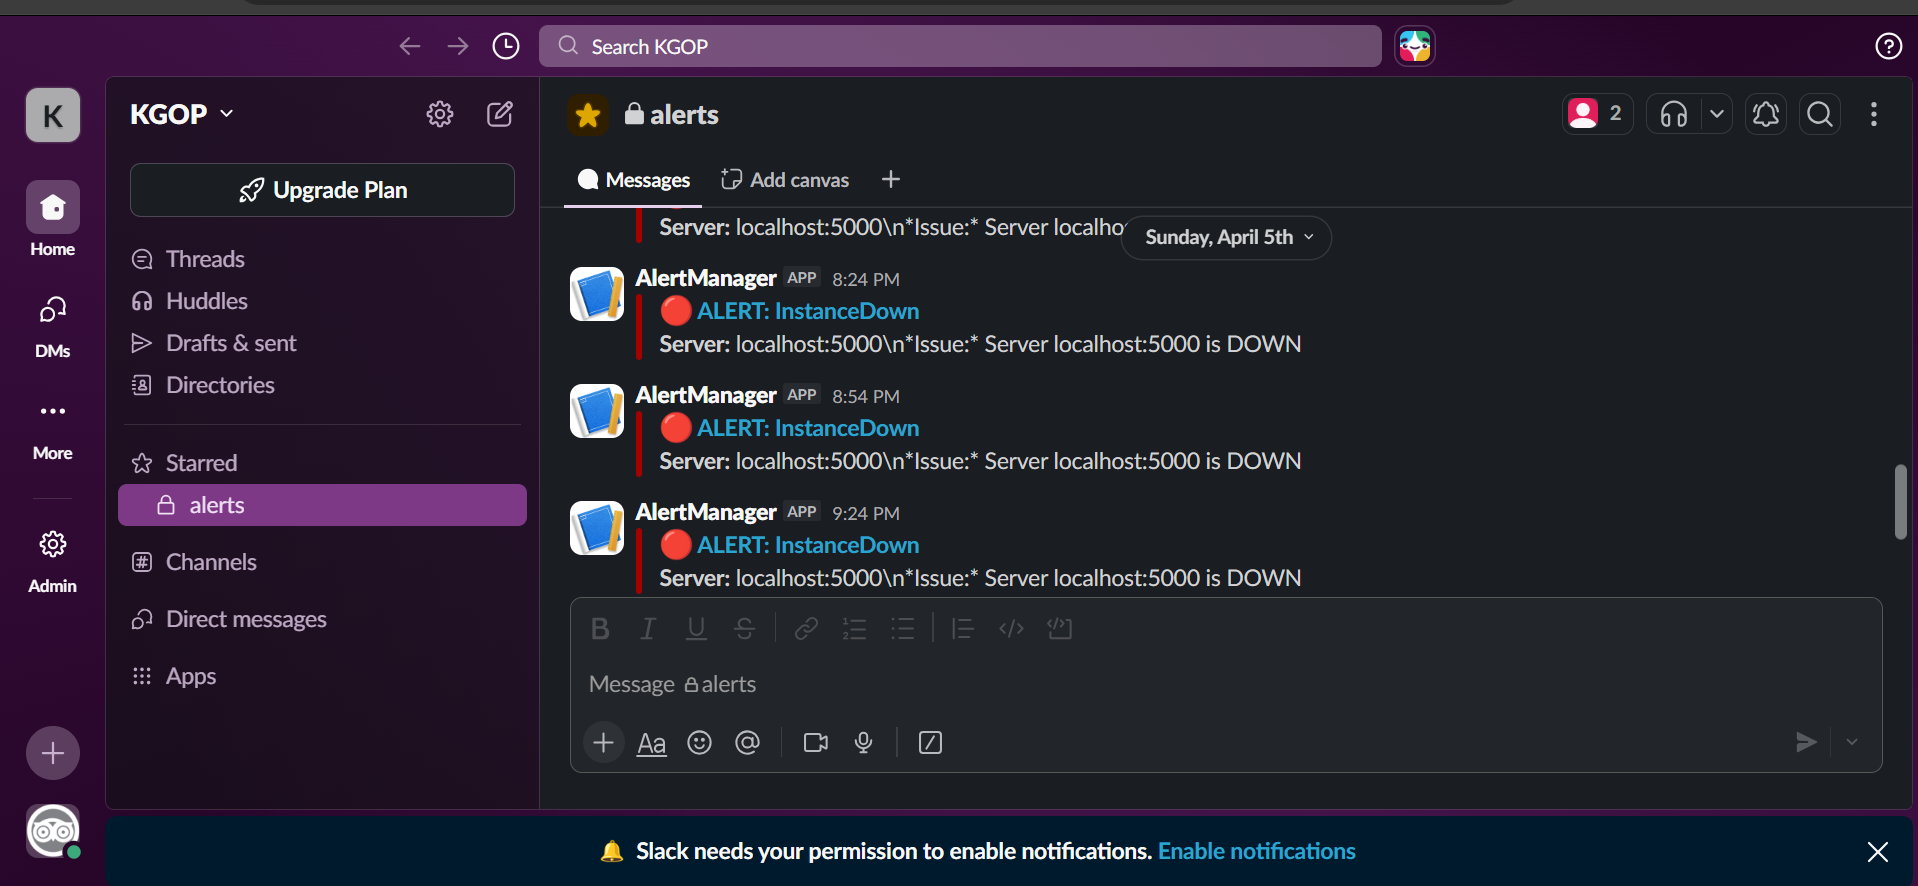
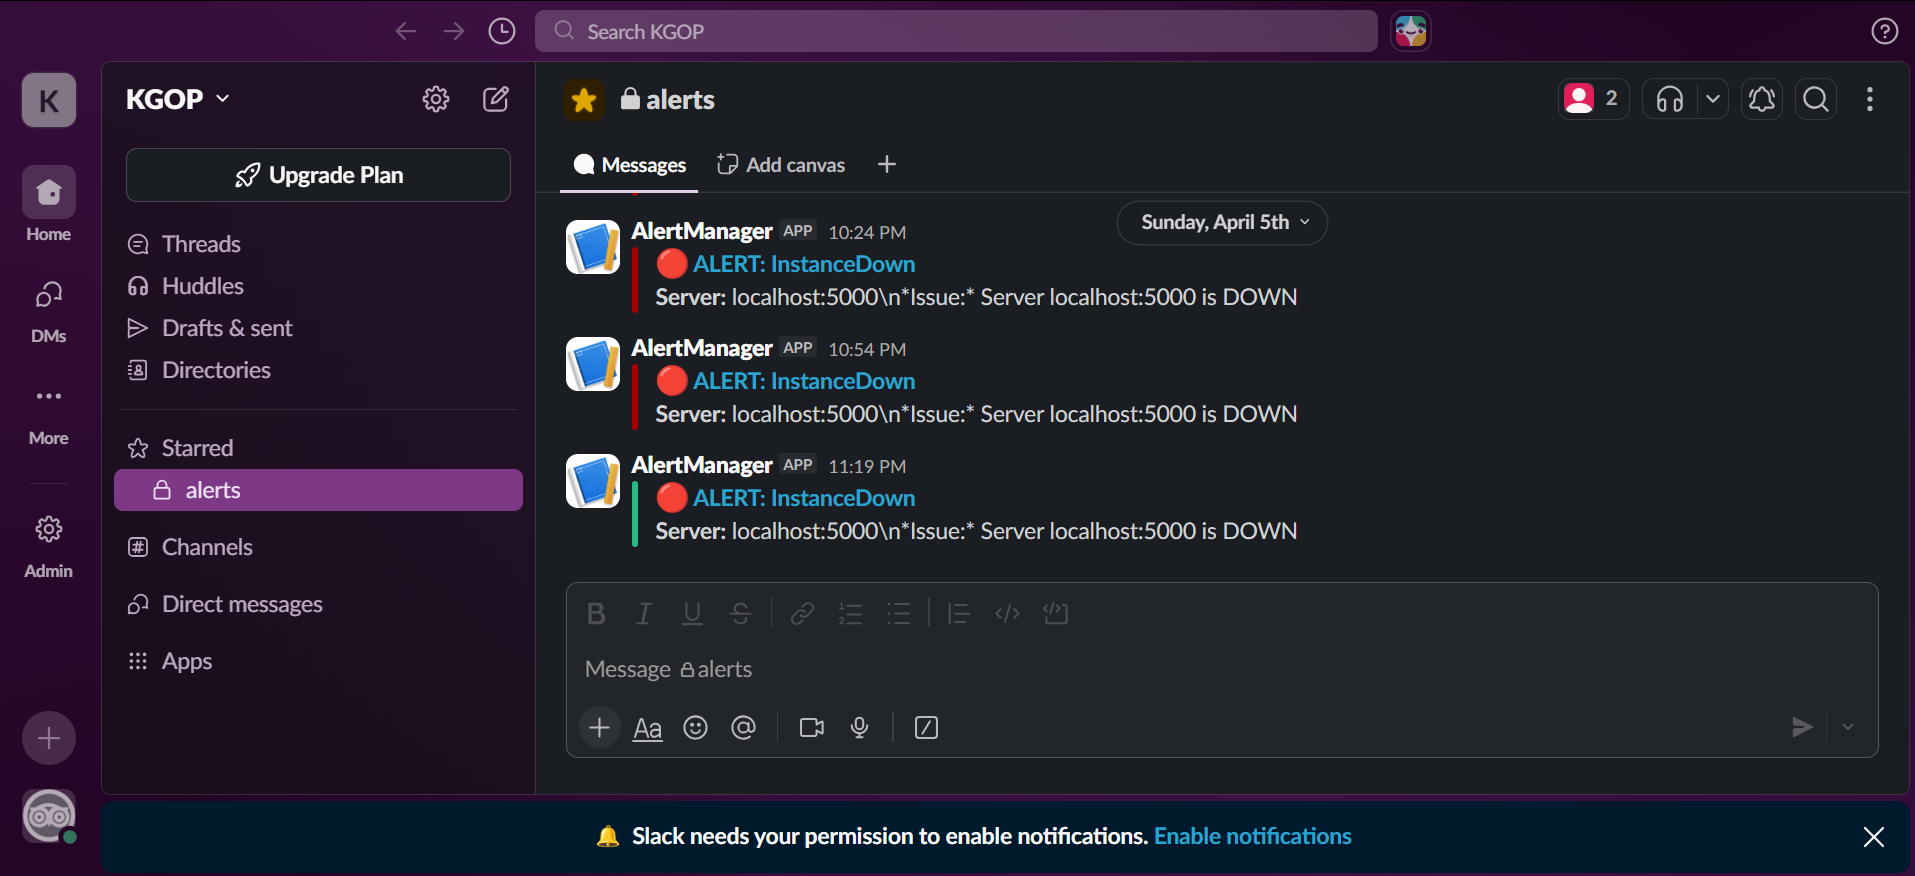
Get Slack webhook URL
Go to api.slack.com/apps → Create New App → Incoming Webhooks → Add New Webhook → pick your channel → copy the URL.
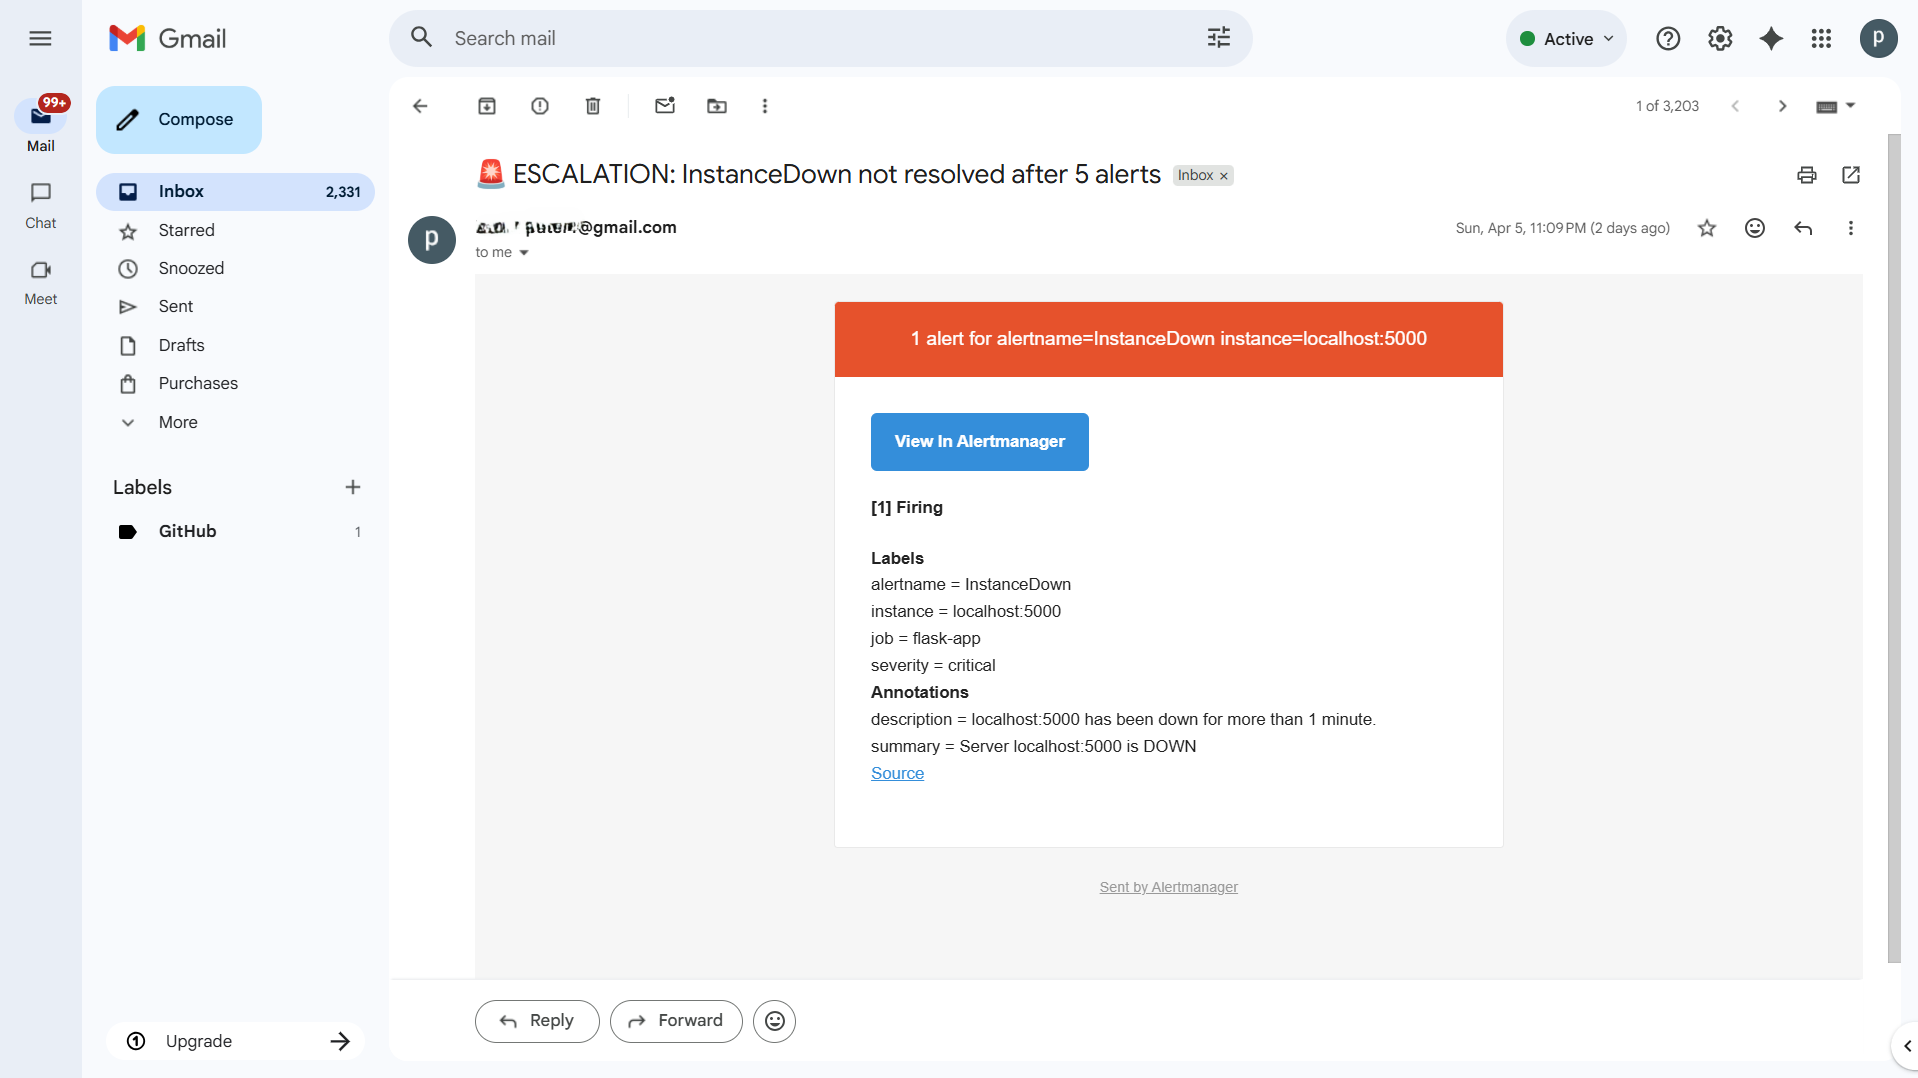
Configure Alertmanager — Slack + Email escalation
global:
  resolve_timeout: 5m
  smtp_smarthost: 'smtp.gmail.com:587'
  smtp_from: 'you@gmail.com'
  smtp_auth_username: 'you@gmail.com'
  smtp_auth_password: 'YOUR_GMAIL_APP_PASSWORD'
  smtp_require_tls: true

route:
  receiver: 'slack-alerts'
  repeat_interval: 5m
  routes:
    - match:
        severity: critical
      receiver: 'slack-alerts'
      repeat_interval: 5m
      continue: true
    - match:
        severity: critical
      receiver: 'email-escalation'
      repeat_interval: 25m

receivers:
  - name: 'slack-alerts'
    slack_configs:
      - api_url: 'YOUR_SLACK_WEBHOOK_URL'
        channel: '#alerts'
        send_resolved: true
        title: '🔴 ALERT✅ RESOLVED: '
        text: '*Server:* \n*Issue:* '

  - name: 'email-escalation'
    slack_configs:
      - api_url: 'YOUR_SLACK_WEBHOOK_URL'
        channel: '#alerts'
        send_resolved: true
    email_configs:
      - to: 'you@gmail.com'
        headers:
          Subject: '🚨 ESCALATION:  unresolved after 5 alerts'
Create alert rules
groups:
  - name: server-alerts
    rules:
      - alert: InstanceDown
        expr: up == 0
        for: 1m
        labels:
          severity: critical
        annotations:
          summary: "Server  is DOWN"

      - alert: HighCPULinux
        expr: 100 - (avg by(instance)(rate(node_cpu_seconds_total{mode="idle"}[5m])) * 100) > 85
        for: 5m
        labels:
          severity: critical
        annotations:
          summary: "High CPU on : %"

      - alert: HighMemoryLinux
        expr: (1 - (node_memory_MemAvailable_bytes / node_memory_MemTotal_bytes)) * 100 > 90
        for: 5m
        labels:
          severity: critical
        annotations:
          summary: "High memory on : %"

      - alert: HighCPUWindows
        expr: 100 - (avg by(instance)(rate(windows_cpu_time_total{mode="idle"}[5m])) * 100) > 85
        for: 5m
        labels:
          severity: critical
        annotations:
          summary: "High CPU on Windows : %"

      - alert: LowDiskLinux
        expr: (node_filesystem_free_bytes{mountpoint="/"} / node_filesystem_size_bytes{mountpoint="/"}) * 100 < 10
        for: 5m
        labels:
          severity: critical
        annotations:
          summary: "Low disk on : % free"
Start and test
# Start Alertmanager
systemctl daemon-reload
systemctl enable --now alertmanager
curl http://localhost:9093/-/healthy

# Restart Prometheus to load rules
mkdir -p /etc/prometheus/rules
systemctl restart prometheus

# Test — stop Flask to trigger InstanceDown alert
docker stop devops-app
# Wait 1 minute — check Slack
docker start devops-app
# Check Slack for RESOLVED message
Documentation: ketulpa.github.io/infrastructure-kb
Author: Ketul Patel — linkedin.com/in/ketulrpatel